
Road transport is an enabler for economic and social life and one of the key sectors of the EU, corresponding to at least 5% of the European Gross Value Added and employing around 10.3 million people. Today, approximately 73 % of the total EU population lives in cities, towns, and suburbs, and the urban population’s share continues to grow. This leads to increased economic activities and urban freight flows driven by megatrends such as globalization, densification, e-commerce, and on-demand logistics.
Urban logistics deliveries are one of the most complex and least efficient freight transport segments, responsible for a significant share of traffic congestion and emissions in EU cities. At the same time, it is an essential service for citizens and comprises a substantial part of all commercial activities contributing to local economic development.
The impact of urban logistics
Moreover, in the last years, cities have become increasingly concerned with the impact of urban logistics on traffic, noise, pollution, land use, and road accidents. With the European Green Deal (EGD) and the Sustainable and Smart Mobility Strategy (SSMS), the EU is striving to reduce greenhouse gas emissions by 90 % by 2050 (compared to the 1990 level) delivered by an innovative, competitive, safe, accessible and affordable transport system, as committed by the Climate Law. Furthermore, the SSMS aims to make all modes of transport more sustainable by identifying specific actions such as Making interurban and urban mobility healthy and sustainable and Greening freight transport. One way to achieve this is to provide well-organized, safe, and environmentally friendly transportation widely.
Sustainable Urban Logistics Plans
To this purpose, Sustainable Urban Logistics Plans (SULP) are considered a crucial policy instrument to bring the freight dimension into more sustainable urban planning processes. Data collection is essential for deriving solid insights about various factors influencing logistics actors’ choices: some cities regularly run travel surveys when defining Sustainable Urban Mobility Plans, while others have run them only at irregular intervals. New technologies to collect information, such as mobile data, web questionnaires, and smartphone apps, provide more precise results but still pose problems regarding population coverage, data quality, response rates, and privacy.
Despite the growing interest raised by urban logistics in the public debate, the related knowledge in European cities is fragmented, and data is not harmonized. This is due to a lack of systematic methodological approaches regarding data collection and subsequent analyses conducted, along with the reluctance of targeted operators to share information in a highly competitive and remunerative market.
This lack of data hinders the proper monitoring of the evolution of urban logistics (e.g., for monitoring the impacts of recent developments in terms of e-commerce penetration, door-to-door courier delivery, food delivery apps, and alternative means of freight transport).
Earlier studies on Urban Logistics pointed out that freight transport is often neglected in surveys and models, very little data is available at the urban level, and data collections are not systematic; therefore, existing data is not comparable. The lack of statistics hinders policy development, given a more sustainable urban freight sector.
Considering the fragmented statistical sources across Europe at the urban level, there is a need for a complete and consistent statistical dataset. Therefore, to develop indicators on the economic, environmental, and usage aspects of this sector and to put the basis for a better understanding of the urban logistics market and actors, the European Commission launched a survey targeted at urban logistics. At the same time, the survey proposes standardized frameworks for further in-depth surveys at the city level.
New EU study on city logistics
This EU study describes the results of the survey undertaken in a selection of 21 EU greater cities in the biggest urban agglomerations of 12 Member States plus the UK. It focused on logistics operators providing delivery services (on their account or for third parties) and was carried out between April 2021 and February 2022. It aimed at understanding the trends and patterns of this logistic segment using specific indicators related to urban logistics.
Two key points of this study are important to emphasize. First, a systematic review of previous studies on urban logistics in the targeted cities was achieved. Secondly, a survey on urban logistics was carried out with an identical methodology in the selected cities. The targeted sample consisted of all freight deliveries by heavy goods vehicles (HGVs) and light goods vehicles (LGVs), owned or working on behalf of logistics companies, traveling in to, out of, and within the boundaries of greater cities. The study did not look at service logistics or vans going to construction sites (both makeup approximately 50 percent of city logistics).
New Mobility Patterns survey targeted urban logistics
This study provides the first comprehensive assessment of several indicators of urban logistics in several EU cities. Some relevant results can be summarised as follows:
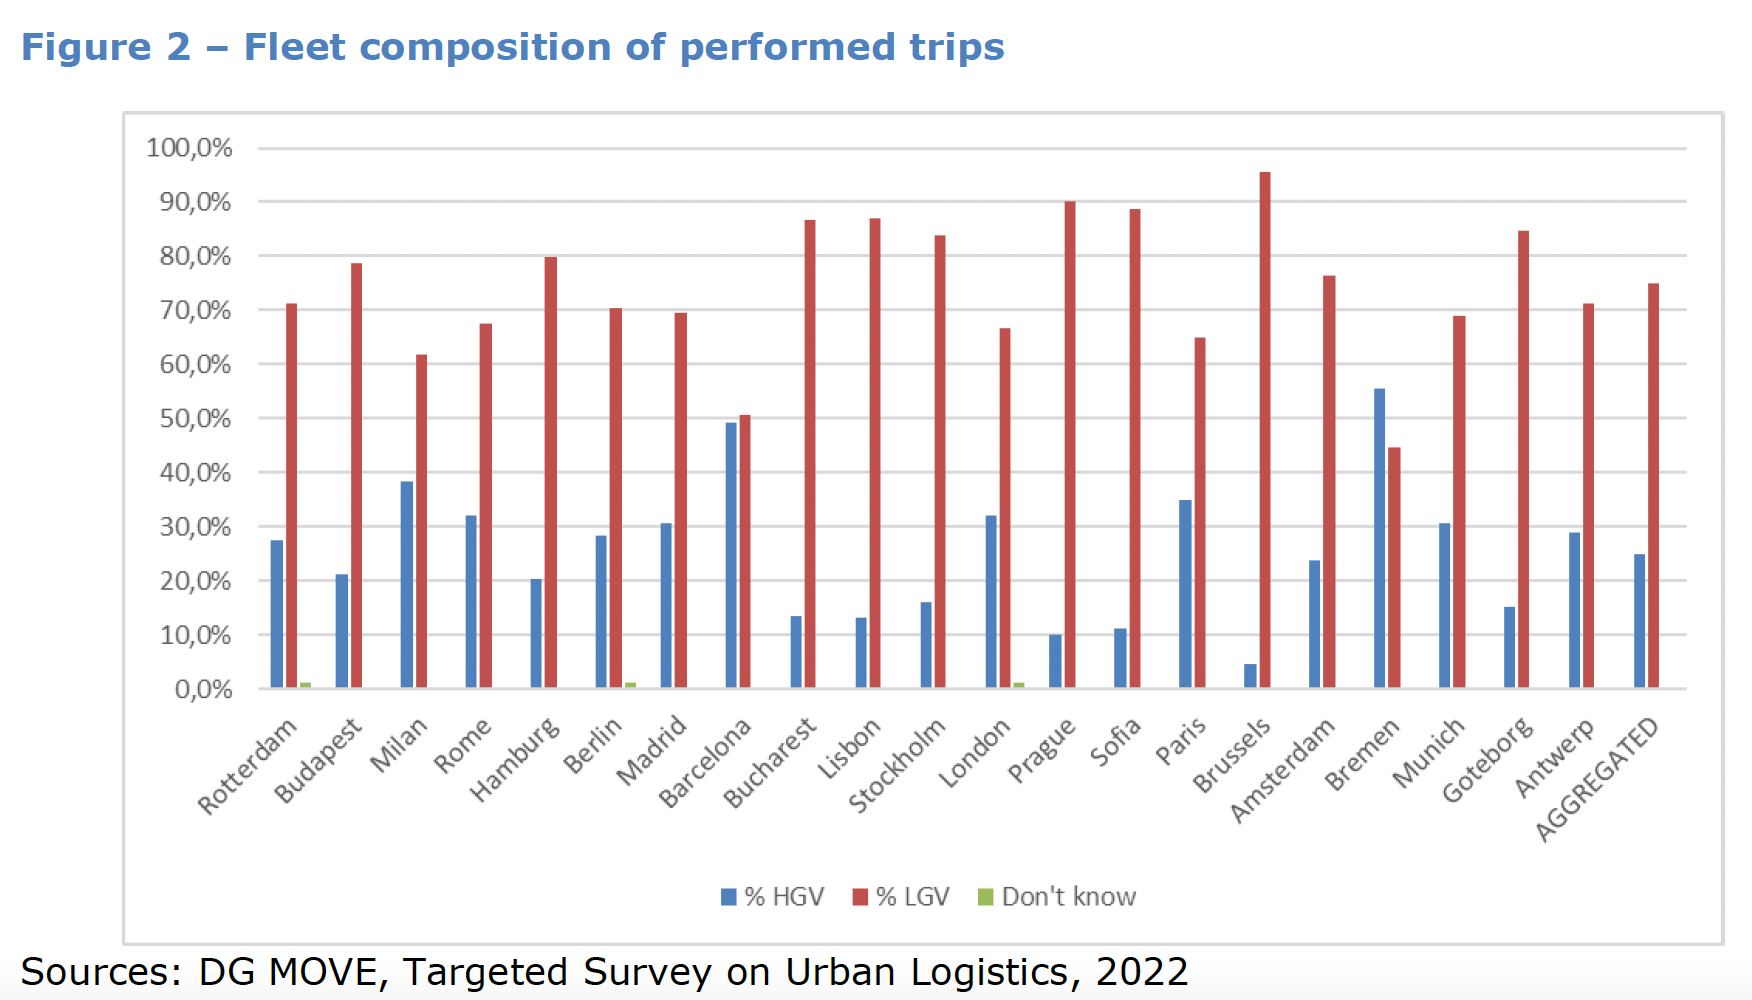
- The fleet composition of enterprises performing urban deliveries presents a greater share of LGVs (57%) than HGVs (27%), with the remaining 16% owning both types of vehicles.
- The share of deliveries per type of vehicle and the vehicle-km reflects the distribution of the fleet composition, with a prevalence of LGVs. On the other hand, tonne-km distribution presents a larger share of HGVs, providing the larger load capacity of such vehicles. This means that freight is mainly brought to cities using higher capacity vehicles, then moved to LGVs used for last-mile distribution.
- In terms of business model, own account operators are prevalent with an average share of 50% at the aggregate level, operators delivering on behalf of shippers and producers are 30%, and those delivering on behalf of other logistics operators are 20%. However, some cities presented exceptions with lower shares of own account operators (Barcelona and Bremen) or higher percentages of enterprises delivering on behalf of other logistics operators (Stockholm), indicating well-interconnected logistics ecosystems with a high level of cooperation.
- The average number of deliveries per trip is between 4 and 10 deliveries.
- At the aggregate level, the average load factor is 50% for both LGV and HGV. Cities with local logistic operators presenting the lowest loading factors are Barcelona (30%), Rotterdam (32%), and Amsterdam (28%). Conversely, those with the highest loading factors are Madrid (74%), Lisbon (78%), Stockholm (72%), and Antwerp (82%).
- Diesel-powered vehicles are largely popular across Europe, except in a few cities. These had a remarkable share of Hybrid Diesel fuel used (Barcelona, 8% for LGVs) and full electric (Stockholm, 53% for LGVs, and Rotterdam, 14% for HGVs), demonstrating that local policies have produced a certain shift to cleaner vehicles. However, when comparing vehicle-km and tonne-km, it became evident that electric vehicles are mainly used for last-mile deliveries and smaller freight volumes.
- Regarding the Euro class and age of the vehicles, Euro 5 and Euro 6 (aged up to 10 years) vehicles are the most common. Still, in some cities, older vehicles (Euro 4 and less) have a relevant share. However, by comparing indicators captured from reported trips related to fleet composition, number of deliveries, vehicle-km, and tonne-km, it becomes clear that vehicles with lower Euro class are used to perform more deliveries but for shorter distances and to transport larger volumes of freight, most likely heading to consolidation centers and not performing last mile deliveries because of circulation restrictions.
- Overall, the median age of vehicles is between 3 and 4 years at the aggregate level, with younger fleets recorded in Bremen, Antwerp, Rotterdam, Berlin, and Stockholm and older fleets recorded in Amsterdam, Bucharest, and Sofia.
- City deliveries performed by bike or powered two-wheelers have a minimal market share. Deliveries by bike and powered two-wheelers are very limited in all cities. 2,58% of enterprises perform deliveries by bike, and 3.65% by powered two-wheelers. In addition, they are not frequently mentioned as a possible solution by logistics operators when asked about policies and measures to reduce CO2 emissions. However, the limited interest in this mode should be further addressed when defining sustainable city logistics policies because it reveals a certain complexity in operations that is not yet fully understood.
- Enterprises declaring to have plans for low-emission logistics mention measures at the same priority level, including collaborative transport, purchasing newer or alternative fuelled vehicles, performing night-time deliveries, or using consolidation centers. Purchasing cargo bike fleets and using parcel lockers are less popular alternatives. However, the number and the distribution of responses do not show differences per city. This indicates a widespread need to work closely with local authorities in optimizing urban logistics operations.
- Most logistic operators with no measures to reduce their carbon fingerprint (between 60% and 70%) mentioned a lack of resources (operational, economic, and financial) as a barrier when adopting low-emission logistics regardless of the NACE category. In addition, lack of support from local authorities and risk of losing competitiveness has a share of about 10% each; both barriers are perceived as significant but not so much if compared to the previous ones and reveal a need for future in-depth analysis of these aspects.
- Estimations for pollutant emissions in cities present an average value at an aggregate level of 34 Kg CO2/trip, given the current mix of vehicles used for deliveries, which could be a statistically significant baseline for computing overall emissions at the city level, knowing the number of vehicles accessing the urban boundaries and the average distance driven per trip. In addition, floating Car Data measurements can efficiently derive this data, providing large samples at limited costs compared to more traditional data collection methods.

This study represents a valuable step towards understanding specific aspects of urban logistics and the status of particular markets in EU cities by comparing relevant indicators. As such, the data collected through the study can serve as a baseline for future data collection and analysis, with a systematic and standardized approach, and to support transport planners and public administrations in developing sustainable urban logistics policies.
Source: EU – European Commission, Directorate-General for Mobility and Transport